Dig Here has added or upgraded more than 48,000 km² of 1 m and 0.5 m LiDAR across Queensland, from the Gympie region to Irvinebank, Chillagoe and Laura Creek. See old diggings under the trees.
This week we added or upgraded more than 48,000 square kilometres of high-resolution LiDAR across Queensland. That is 271 surveys and 46,639 map tiles at 1 m and 0.5 m, built from Geoscience Australia data. Queensland now has about 160,000 square kilometres on Dig Here at 1 m or better, roughly 9% of the state.
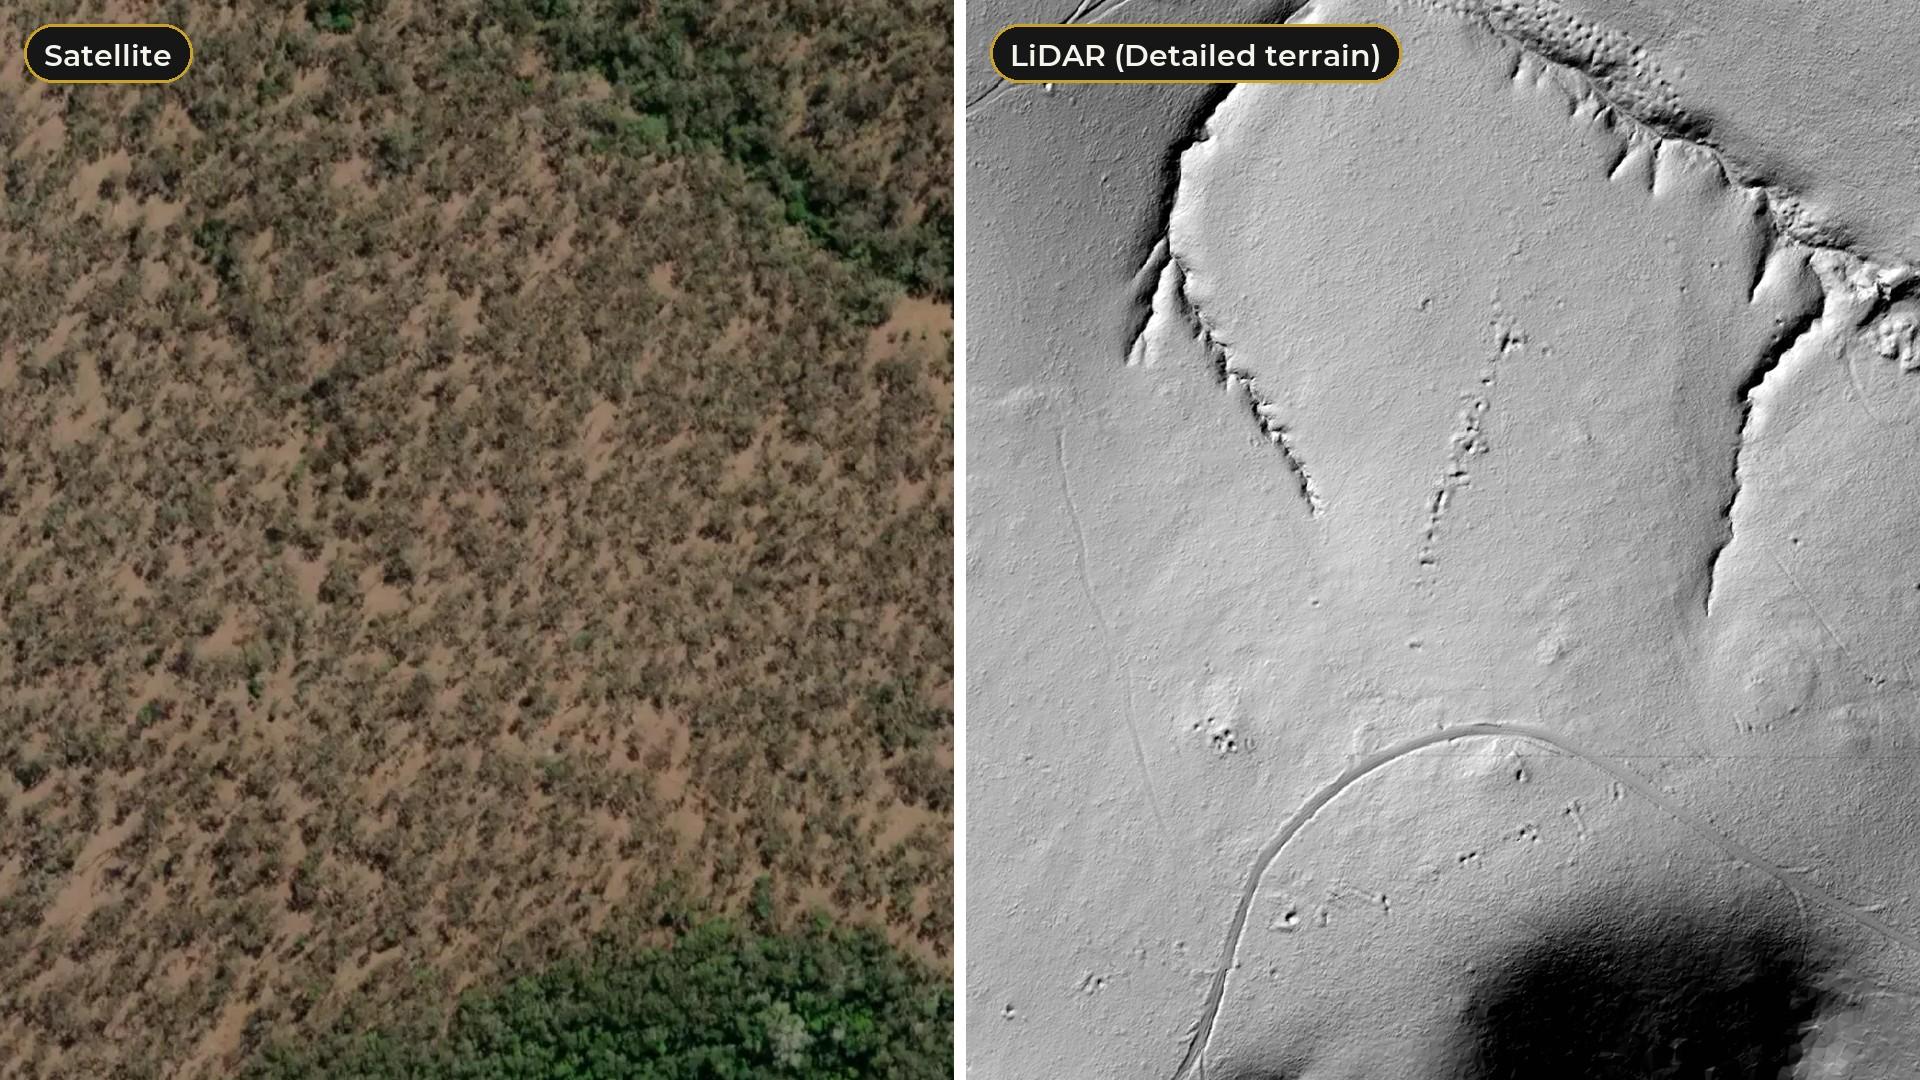
LiDAR strips the trees away and shows the bare ground underneath. That is where the old-timers left their mark: the shafts they sank, the pits and trenches they dug, the gullies they sluiced and the water races that fed them. On a satellite photo you see scrub. On LiDAR you see the diggings.
What's new, region by region
Here are some of the highlights. Every area below is live on the map now. Old gold workings counts come from the government mine records on the map, counted inside the new scans.
Gympie region: 0.5 m scans around Kilkivan and Elgin Vale
The new Gympie region scans are 0.5 m, our sharpest kind, and cover country west of Gympie near Mudlo and Kilkivan, and around Elgin Vale and Manumbar. Near Elgin Vale, the mine records on the map name the Black Watch Reef, the Wild Horse Reef and German's Gully, all recorded for gold. On the LiDAR you can see what they left: a line of pits running down the slope, and a gully floor pocked with dozens of small pits.
Somerset region: Mount Stanley to Jimna and Emu Creek
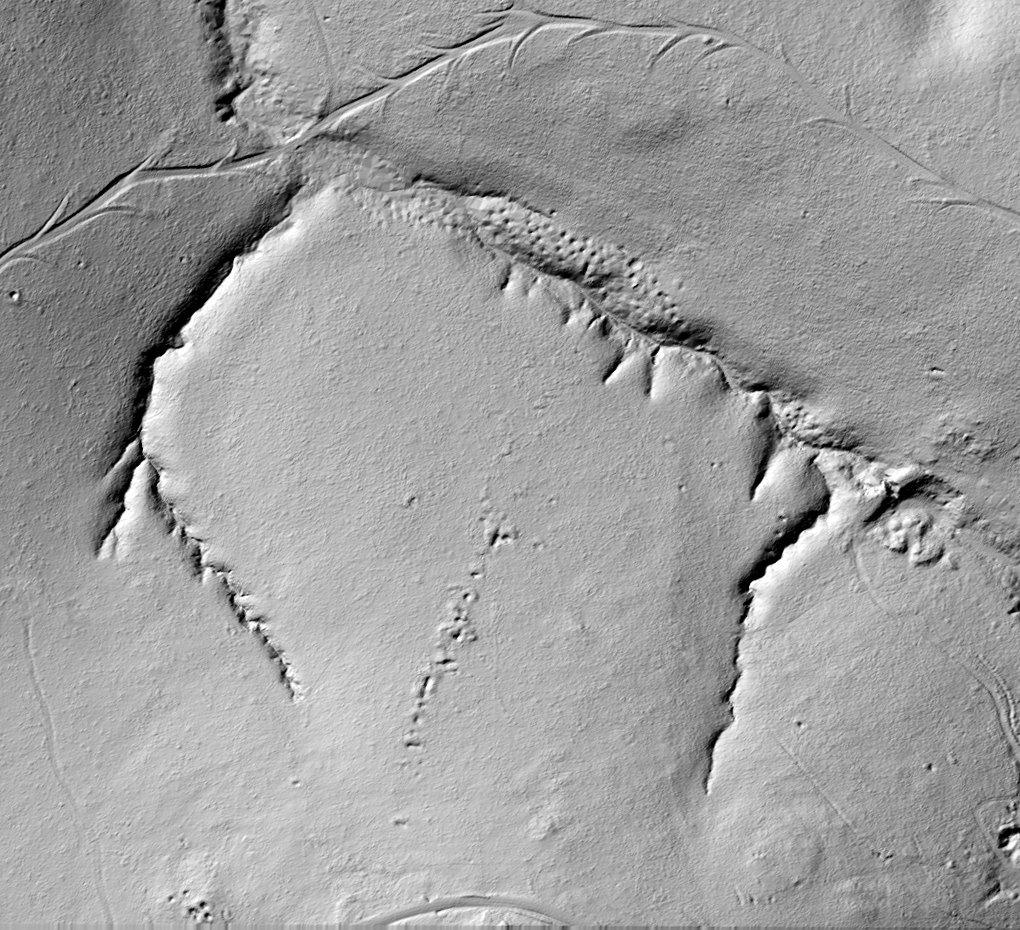
The Somerset scans, mostly 0.5 m, cover about 890 square kilometres of hill country, from around Mount Stanley and Jimna down to Emu Creek. Near Emu Creek, the records on the map list the Mount Langan, Yellow Ore, Silver Knob and General Jim mines, recorded for gold, silver and lead. On the LiDAR the knoll they sit on is lumpy, dug-over ground, with a short line of workings on the slope above it.
Irvinebank: a town surrounded by shafts
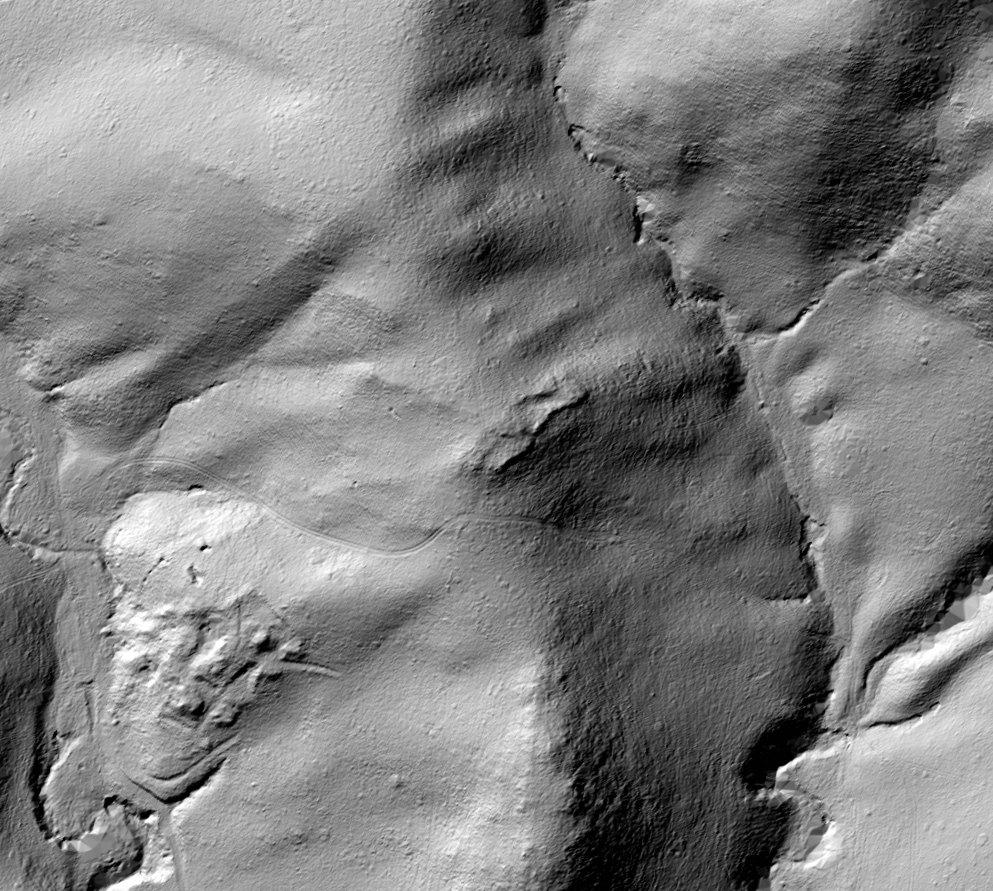
The new Irvinebank scan covers the town and the hills around it. There are more than 250 recorded old workings inside it, almost all of them shafts. On the LiDAR you can pick out the town's streets, a dam in the valley, old tracks winding up the slopes and the hillsides where the shafts cluster.
Chillagoe
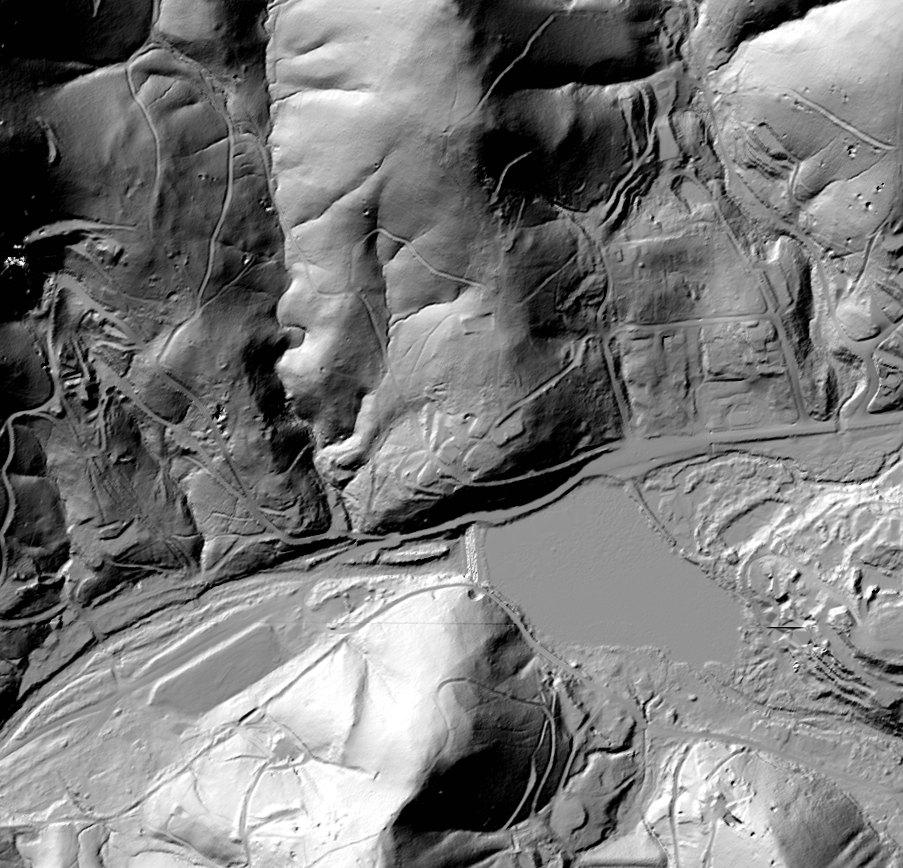
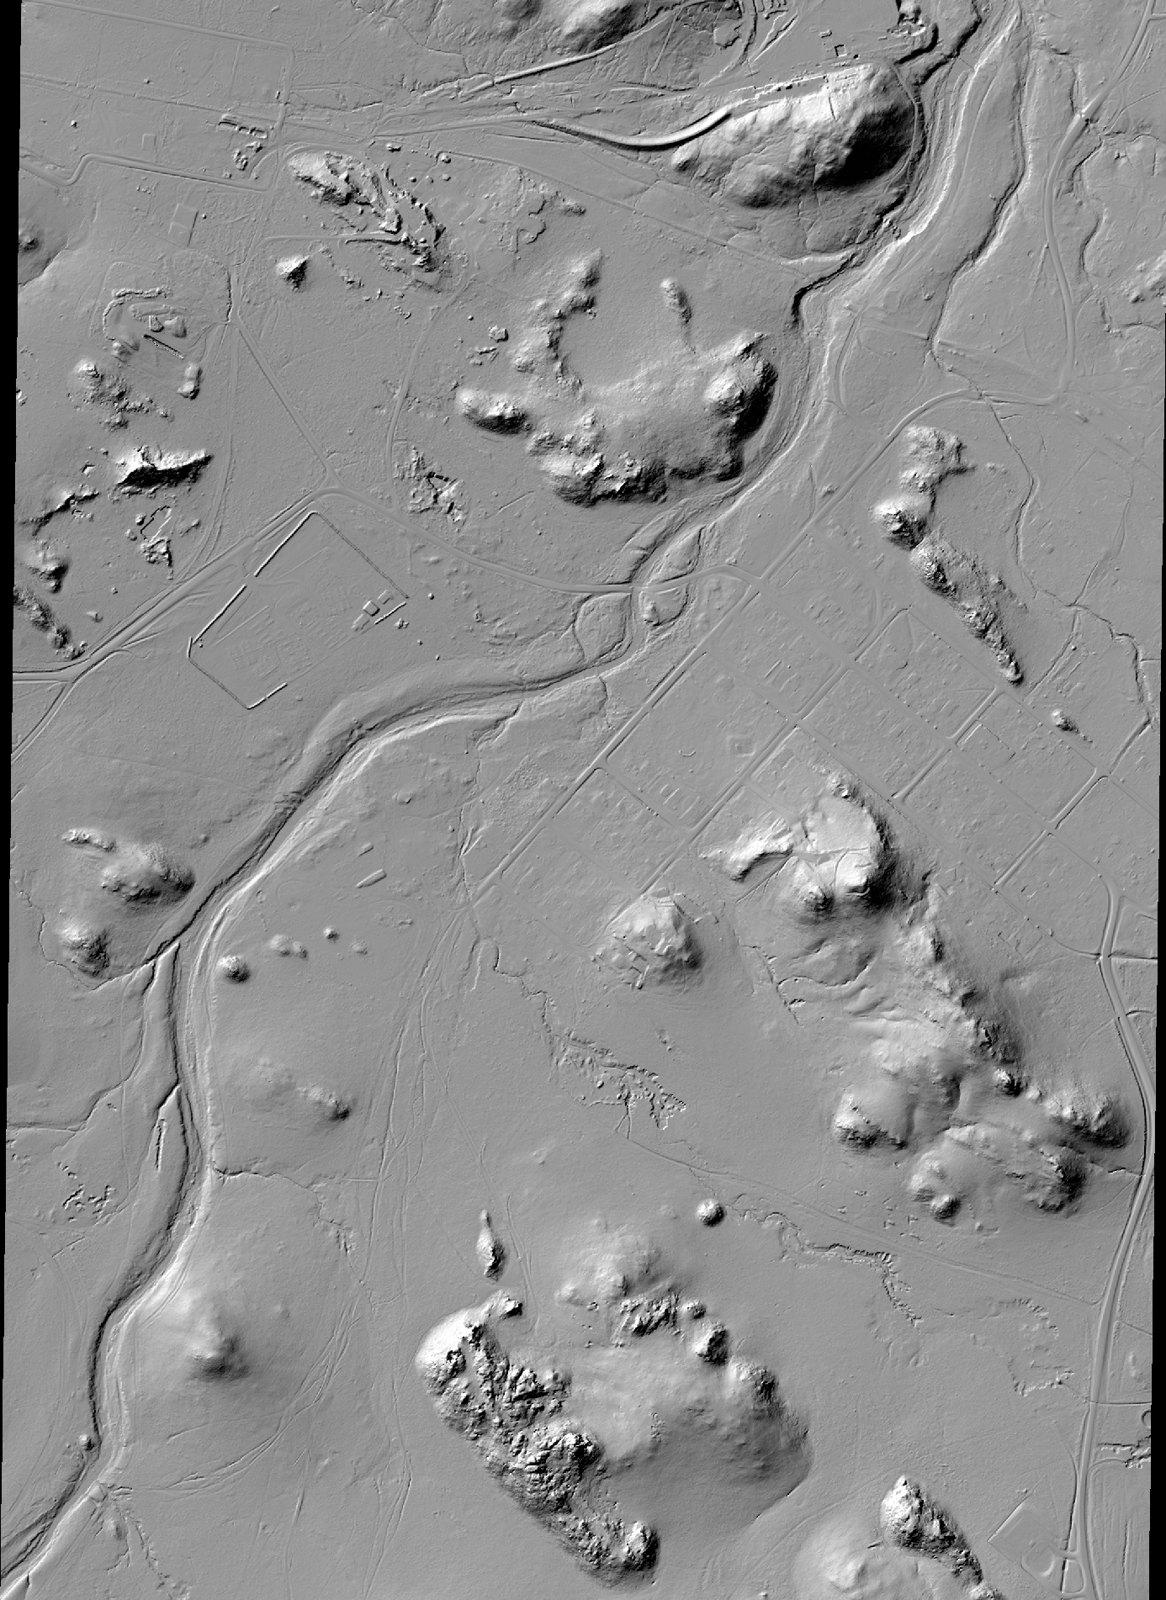
The Chillagoe scan takes in the town and the river beside it. Rocky outcrops stand up out of the flats like islands, and the LiDAR shows every bluff, track and channel in sharp detail.
Nulla basalt: 3,420 km² at 0.5 m
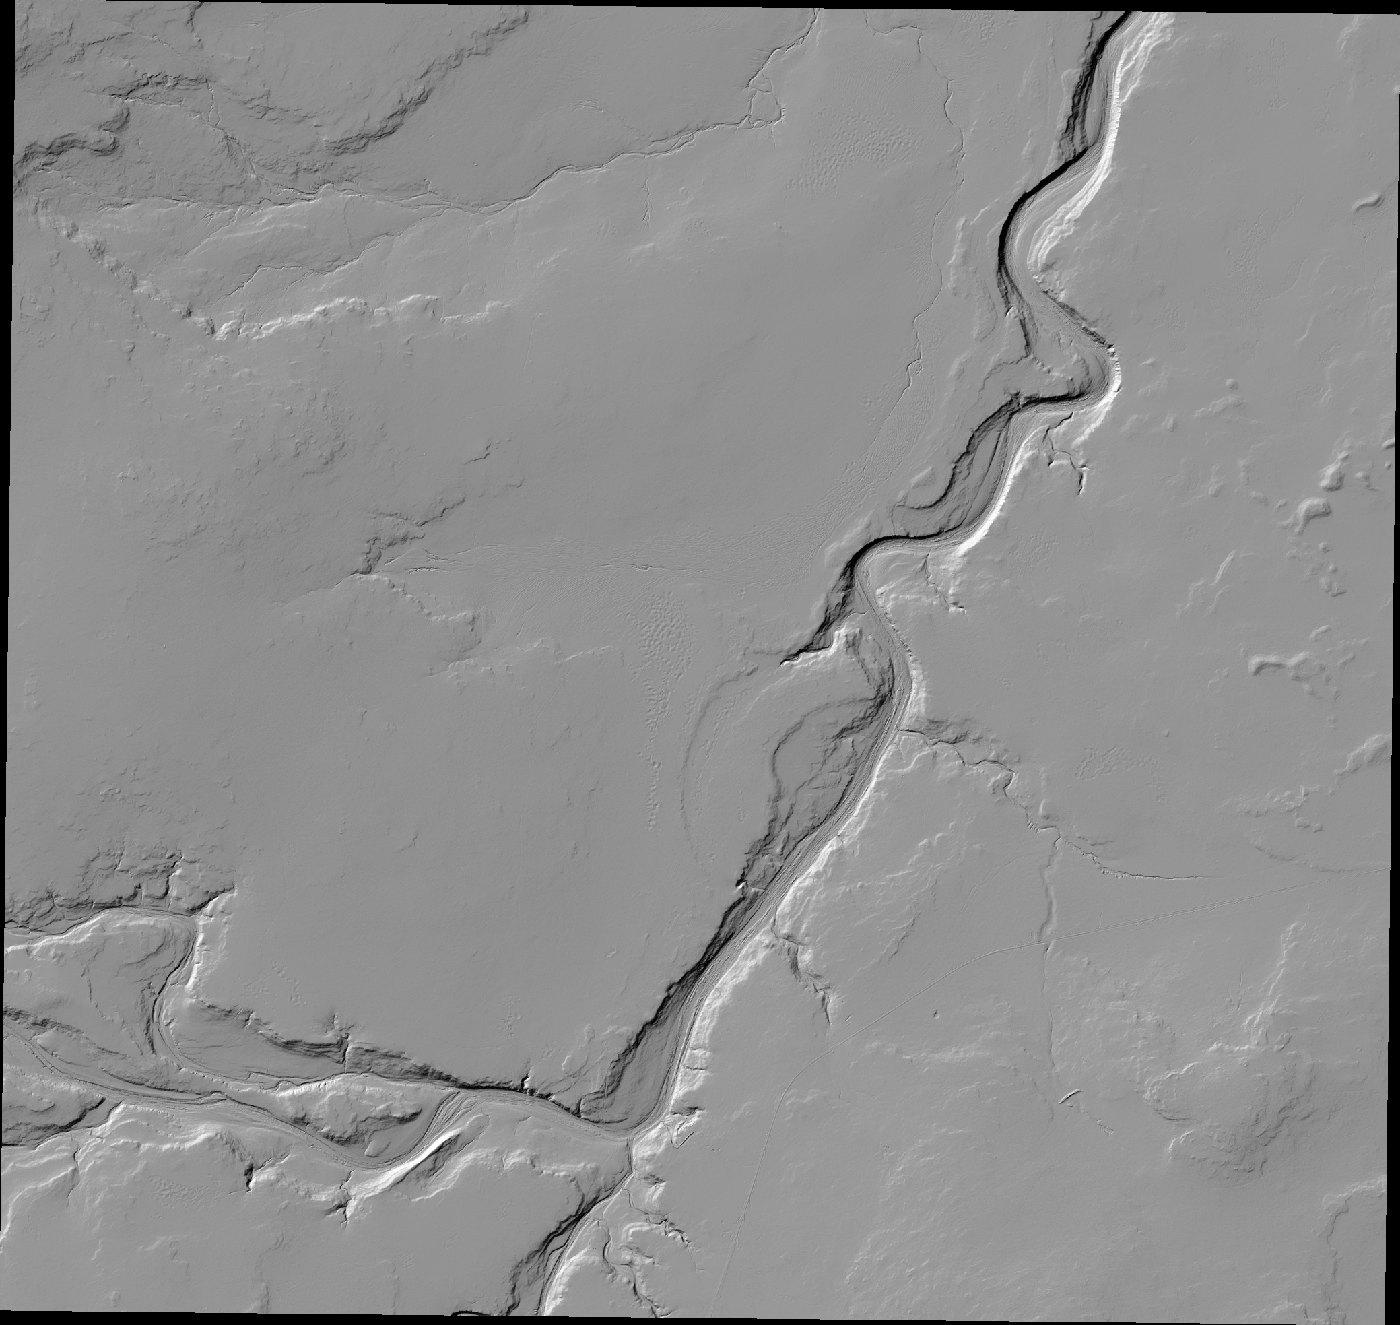
The biggest single block this week is the Nulla basalt survey: 3,420 square kilometres at 0.5 m, inland from Townsville. The ground is wide and flat, so every creek and river cutting through it stands out, along with its banks.
Laura Creek: about 1,850 km² at 0.5 m
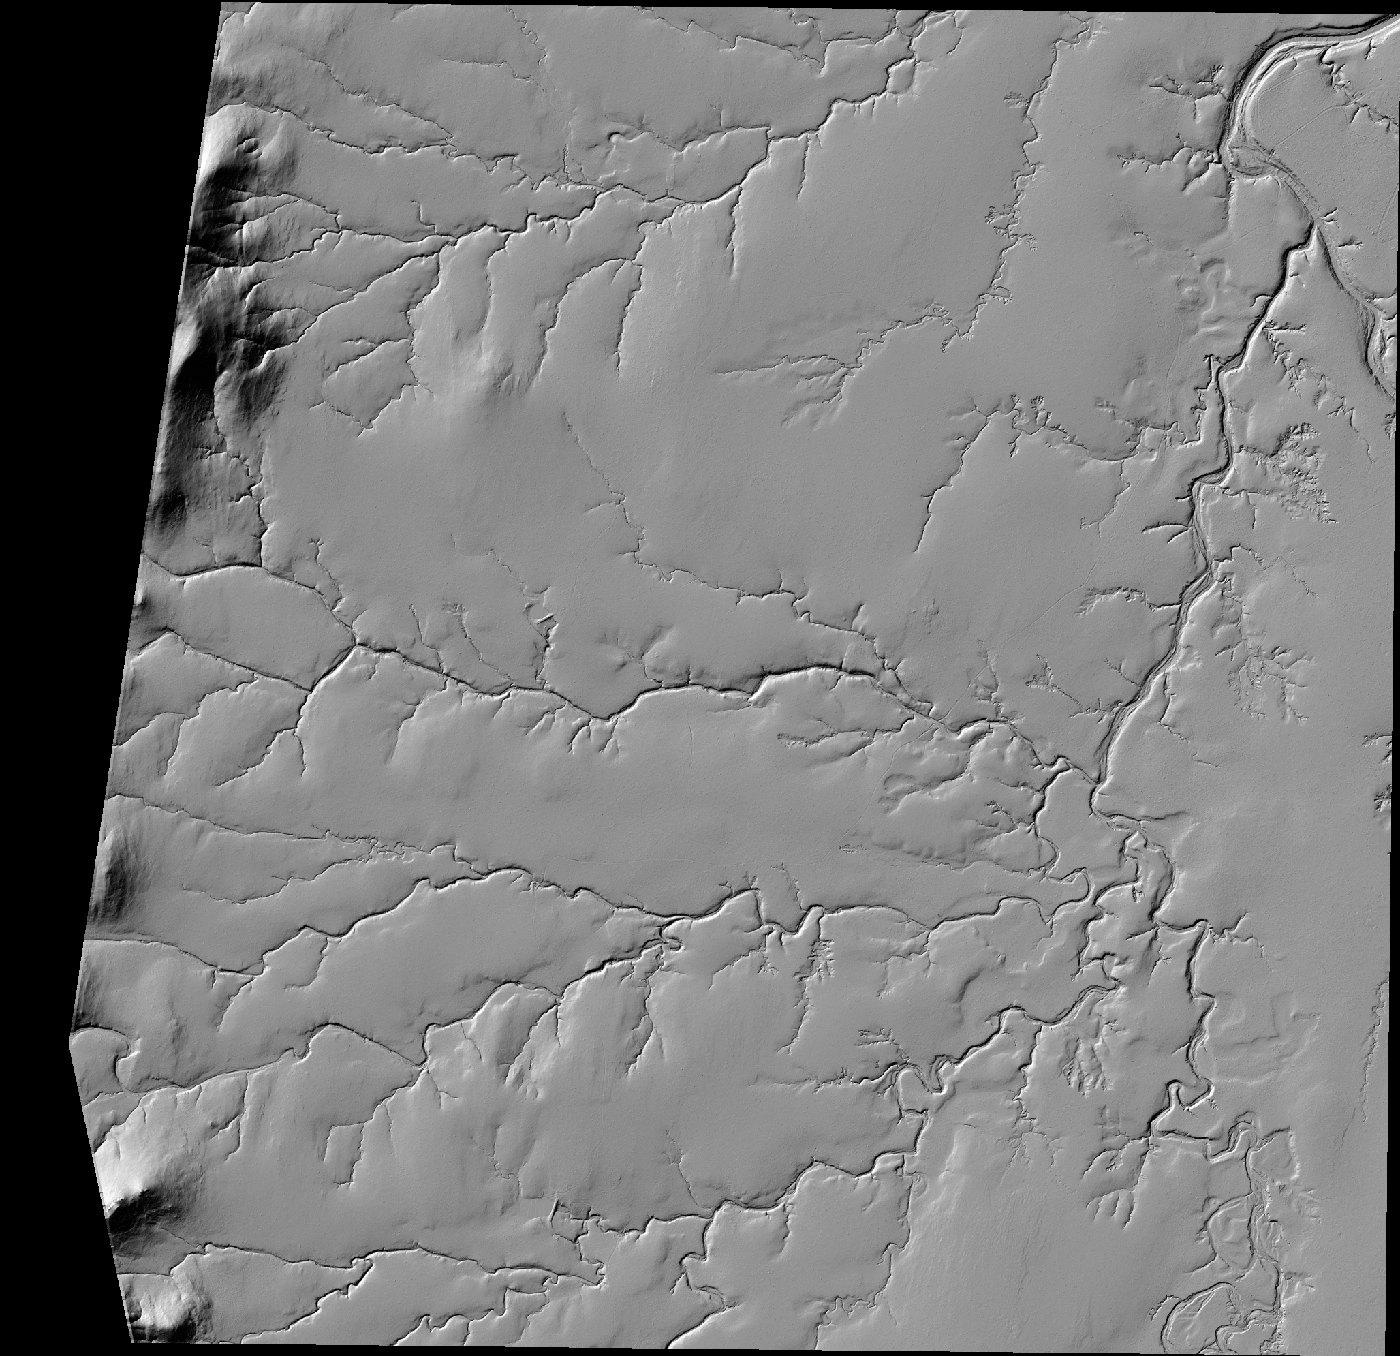
South-east of Laura, out towards Lakeland, the Laura Creek survey adds about 1,850 square kilometres, almost all of it at 0.5 m. It shows a branching web of creeks and gullies, the kind of detail that helps you work out where the water has been running and where it slows down.
And across the rest of Queensland
- Mount Surprise: about 90 square kilometres around the town.
- Mount Coolon: new scans near the town.
- Charters Towers: new ground on the northern edge of town, around Columbia and Toll.
- Mount Perry: a new scan in the hills near Mount Perry.
- Cooktown district: new scans west of Cooktown around Jansen and Marton, and near Bloomfield.
- Emerald: about 290 square kilometres around the town.
- Charleville, Augathella and Longreach: about 2,000 square kilometres of town and surrounding scans across the west.
That is only a sample. The full update covers 271 surveys across the state, so open the map and have a look around your own patch.
How to see it on the map
- Open the Dig Here map on the web, or in the Dig Here app on the App Store or Google Play.
- Turn on Detailed terrain.
- Zoom in. The LiDAR sharpens as you get closer, and at full zoom you can pick out single pits and shafts.
- Turn on Old gold workings to see whether recorded mines line up with what you are looking at.
- Tap any spot for Can I fossick here? You get a straight yes or no, the reason, and what you need.
Want a refresher on reading the shapes? Our guide to how to find gold with LiDAR walks through pits, mullock heaps, trenches, water races and sluiced ground, with real examples.
Before you go: check you can dig there
LiDAR shows you where people dug. It does not tell you whether you are allowed to. Most old workings sit on private land, mining leases or reserves, and none of the spots in this post is a recommendation to go digging.
- In Queensland you need a fossicking licence everywhere.
- Private land needs the landholder's permission. Mining leases need the holder's permission.
- Tap the spot on Dig Here before you go. Can I fossick here? gives you a YES or NO, the reason and what you need. It is free.
- Old shafts are dangerous. Many are open, hidden in long grass or capped with rotten timber. Keep well clear.
FAQ
What is LiDAR?
A laser scanner flown in a plane. It measures millions of points, keeps the ones that reach the ground, and builds a model of the bare earth with the trees taken off. That is why old workings under the bush show up.
How much new LiDAR is there?
More than 48,000 square kilometres added or upgraded this week, across 271 surveys. Queensland now has about 160,000 square kilometres at 1 m or better on Dig Here, about 9% of the state.
Which plan do I need?
The 1 m and 0.5 m LiDAR is on the Fossicker and Digger plans. The Free plan has the map, Old gold workings, mining leases and Can I fossick here? on every tap.
Is my area covered?
Turn on Detailed terrain and zoom in. Where we have high-resolution LiDAR you will see the sharp detail. Where there is no detailed scan, the map falls back to the best terrain shading available.
Can I fossick at the spots in this post?
Not without checking. These spots are here to show what the new LiDAR can see. Tap any spot on the map for a YES or NO and what you need, and remember you need a Queensland fossicking licence everywhere.
Does it work on my phone?
Yes. The Dig Here app is on the App Store and Google Play, and the map works in any browser.
Image credits: LiDAR renders made from Geoscience Australia ELVIS and Queensland Government data, CC BY 4.0. Satellite imagery (c) Mapbox, (c) Maxar. Old gold workings: Geological Survey of Queensland and Geoscience Australia.